(Compiled based on the materials of the Teaching Materials on Geography: textbook Dronov V.P. et al. Geography of Russia. Population and economy. Grade 9. The sixth lesson in the section “General part of the course”, the fourth lesson in the topic “Population of Russia”, § 7)
Subject. Population migrations.
Lesson type: combined.
Type (form) of the lesson: traditional lesson.
Used technologies (techniques): technology of application of basic schemes.
Teaching methods: explanatory and illustrative.
Objectives: 1. Educational:
- form an idea of migration flows in Russia;
- to study the features of the movement of the population on the territory of Russia;
- introduce the concept of “migration”, consider the types of migrations;
- introduce and achieve mastery of the concepts of “emigration”, “immigration”, “refugee”, “forced migrant”, “repatriation”, the ability to distinguish and characterize them with examples;
- identify and facilitate the assimilation by students of the content of the problems that arise during active migration and outline ways to solve them.
2. Developing:
- develop the skills and abilities of working with maps, statistical material, methods of “folding information” and drawing up reference diagrams.
3. Educational: to promote the formation of a scientific worldview, to cultivate a tolerant attitude towards representatives of various nationalities and religions, love for the motherland, the desire to realize one's abilities in Russia.
Lesson equipment:
Board: used for drawing up work diagrams by the teacher, for placing maps and tables (Political-administrative and physical maps of Russia), arrows for drawing up a map.
Didactic handout: statistical data.
UMC: textbook, maps of the atlas (political and administrative), fig.12 (p.35), fig.13 (p.41), fig.14, 15 (p. 42-43) of the textbook and table 12 (p. 40) of the textbook .
Lesson Plan
I. Organizational moment (1 - 2 minutes).
1) Frontal express poll on a chain.
2) Individual survey on didactic cards
IV. Generalization, summary of the lesson (5 min).
V. Homework (3 min).
Goal setting: instruction on homework.
During the classes
I
. Organizing moment (1 - 2 minutes).II. Actualization and control of knowledge (10 - 12 min).
Target setting: to check the level of assimilation of knowledge on the topic “The national composition of the population of Russia”.
1. Frontal express survey (a token is issued for the correct answer; a mark is set according to the number of tokens: 8 tokens - “5”, 6 tokens - “4”):
- What is the population of Russia on January 1, 2008?
- What is Russia's place in the world in terms of population? Name the countries to which Russia is inferior in terms of population.
- How is the population of Russia changing? Why?
- What is called natural population growth?
- What is the difference between absolute and relative natural population growth?
- What is a demographic crisis?
- What are the causes of demographic crises? Example?
- What is natural population movement?
- Explain the term "demographic scissors".
- What is called fertility?
- What is mortality?
- What chart allows you to get information about the sex-age structure of the population?
- Why is Russia called a multinational state?
- How would you define the term "people"?
- What is the difference between the concepts of “nation”, “tribe”, “nationality”, “people”?
- How many republics Russian Federation?
- By what principle is Russia divided into federal units?
- Name the language families in the country.
- Which language family is the most multinational?
- Name the most numerous people of Russia. What language family does it belong to?
- Formulate the definition of the term “titular people”.
- Name using the table. 17 on p.37 of the textbook, republics with a predominance of the titular people. Name the republics of Russia with a predominance of the Russian population.
- Why is there a gradual decrease in the indigenous population in national entities?
- What religions are common in Russia?
- What is the peculiarity of the ethnogeographic position of Russia?
2. Individual survey on didactic cards - work with the atlas
Card 1
1. Where are local traditional beliefs spread in Russia?
2. Give examples of the peoples of Russia who are adherents of local traditional beliefs.
Card 2
1. Where do Buddhists live in Russia - Lamaists? Why in these areas?
2. Determine which peoples of Russia are adherents of the religious teachings of the Buddha and Lama (Buddhist-Lamaists).
3. What language family do these peoples belong to?
II. Learning new material (15-18 min)
Goal: find out the meaning of the term “migration” and learn to identify types of migration
It is carried out on the basis of drawing up the scheme “Types of migration”
1. Reasons for migration - compiling scheme.
2. Types and features of migrations - drawing up a “Migrations” scheme
- when studying deportation - work with a textbook (p.35, fig.12);
- in the study of forced migration - analysis of Fig. 14 p. 42 of the textbook;
- when concretizing the political reasons for migration, work from Table 12 on p. 40 and Fig. 13 on p. 41.
III. Consolidation of the studied material (5 min).
Target setting: training in identifying types of migration.
1. Task: Determine what type of migration each participant in the story makes. Maybe several types at the same time.
Ivanov complained that he did not find his friend and ran to share his joy with his sister Natashka. But my sister was also not at home: she signed a contract and left for Nefteyugansk for 2 weeks to control oil production in Western Siberia. On the other hand, he met his aunt, who used to live in Tajikistan, but because of the deteriorating situation of the Russian population, she moved to live in Russia forever.
“This is migration,” Ivanov thought, and went home to pack his bags.
Answer: Ivanov- temporary, seasonal, episodic. Sidorov- emigrant. Great-grandmother Sidorova- during the war - violent; after the victory - repatriation. Natalya (Ivanov's sister)– labor shift-expeditionary migration. Aunt Ivanova- remigration.
2. Task: Analyze the data of the State Statistics Committee of Russia and determine your position on the issue: is the migration influx into the country a blessing or a disaster for Russia?
According to estimates, the number permanent population of the Russian Federation as of August 1, 2008 amounted to 141.9 million people and from the beginning of the year decreased by 125.1 thousand people, or 0.09% (as of the corresponding date of the previous year - by 194.7 thousand people, or 0.14%).
The decrease in the population was due to the natural population decline, which in January-July 2008. decreased compared to the corresponding period of 2007. by 63.5 thousand people. The increased migration growth by 53.8% compensated for the numerical losses of the population (Figure 1).

(According to the State Statistics Committee of Russia)
IV. Generalization, summary of the lesson (5 min).
Target setting: to summarize the studied material.
- Does the country need data on migration flows? For what? What are the functions migration services?
- When, in your opinion, migration can be considered a negative phenomenon in the life of the country, and in what cases - conditionally positive?
- What is the significance of migration (external and internal) for Russia?
- What types of migration would you like to make in the near future?
V. Homework (3 min).
Target setting: § 7, questions 1-6 (oral) on p. 44, scheme in a notebook.
Subject: Placement and migration of the population.
Goals and objectives:
To form students' understanding of the main features of the distribution of the population on land and to establish the reasons for the uneven distribution; types of population migrations and causes causing migrations.
Continue developing skills in working with geographical maps, tables for analysis, specification of individual provisions of the topic; make the necessary comparisons.
Cultivate a sense of responsibility in preparing for the lesson, the ability to listen to classmates, as well as use your life experience, media information to specify the topic of the lesson.
The lesson is developed taking into account the calendar-thematic planning. This is the third lesson on the topic: "The population of the world." By type of lesson - the study of new material.
The structure and content of this lesson are determined by the goals and objectives:
- Using a fragment of a video film for staging, revealing and updating the topic of the lesson;
- Communication of new material using systematizing tables and maps;
- Statement of a problematic question to consolidate the studied material;
- Final consolidation in the form of mutual verification;
- Homework taking into account the RUV of students.
The lesson uses:
the following methods are reproductive: verbal, visual, practical; heuristic: partial-search with the transition to the problematic one.
forms of work: frontal; work in pairs; individual.
The material of the lesson is presented in an accessible, scientifically sound manner. The lesson uses elements of multi-level training (reproduction of material and analysis).
The time in the lesson is distributed rationally. Links between stages are logical. Lesson vyglit as a whole.
TCO, visual aids, didactic material are used in accordance with the goals and objectives of the lesson.
Control of mastering knowledge is carried out during the execution of tasks. Control is carried out in the form of frontal work, individual work and in the form of mutual verification.
Download:
Preview:
Topic: Placement and migration of the population.
Goals and objectives:
To form students' understanding of the main features of the distribution of the population on land and to establish the reasons for the uneven distribution; types of population migrations and causes causing migrations.
Continue developing skills in working with geographical maps, tables for analysis, concretization of certain provisions of the topic; make the necessary comparisons.
Cultivate a sense of responsibility in preparing for the lesson, the ability to listen to classmates, as well as use your life experience, media information to specify the topic of the lesson.
Equipment:
Maps "Population density of the world", " political map world"; atlas, textbook,
a notebook, a fragment of a video film, a dictionary, handouts (for each student).
During the classes:
Using a fragment of a video film for staging, revealing and updating the topic of the lesson.
I) Learning new material.
1. Placement of the population on Earth.
The distribution of population across the globe is extremely uneven. About 70% of all mankind lives on 7% of the territory. More people live in the Eastern Hemisphere than in the Western Hemisphere. More in the northern hemisphere than in the southern hemisphere. 15% of the land is completely undeveloped by people. These are areas with extreme natural conditions. Naturally, people settled and developed, first of all, the most favorable territories for life and rich in various conditions and resources.
The average population density is 45 people/km, but this indicator may hide very large differences between individual territories. Along with this, about 50% of the inhabited land has an average density of 5 people / km.
A certain number and density of population are necessary prerequisites for the development of each country.
What are the min and max population density indicators and for which areas are they typical?
2. Practical task.
2.1 Analyze the World Population Density map in the atlas and fill in the diagram:
Population placement
_________________ ____________________ ________________
_________________ ____________________ ________________
Appendix 1.1
What influences the distribution of the population in the world and in a particular country? Let's find out.
2.2 Practical task.
Compare and analyze the maps "World Population Density" and " physical map peace." Fill the table. Draw your own conclusions.
State | China | Canada | Australia | Russia |
Mainland | ||||
Max Density | ||||
Where? | ||||
Why? | ||||
Min density | ||||
Where? | ||||
Why? |
Conclusion: ________________________________________________
____________________________________________________________________________________
Appendix 1.2
3. Migration of the population.
"People," wrote N. N. Baransky, "are not migratory birds, their migration is explained not by biological, but by social laws."
Student (work with a dictionary):
Migration is the movement of people from one place of residence to another.
Appendix 1.3
International migrations of the population arose in ancient times, continued in ancient times - primarily in the era of the Great Geographical Discoveries, but received the greatest development in the era of capitalism.
The biggest migration explosion began in the 19th century in Europe, "pushing out" part of the population - free lands and demand for labor. 60 million people left Europe.
Asia - Chinese and Indian workers - were recruited to work on plantations and mines.
USA, Canada, Brazil, Argentina, Australia.
After the Second World War, the size of international migration began to increase again, and by the end of the 20th century there was a "migration explosion".
Pupil (work with additional literature)
Appendix 1.4
What are the types of migration and the reasons affecting the movement of the world's population?
4. Practical task.
4.1 You have cards with the names of the types of migrations on your tables. Look at the diagram and let's try to classify the types of migrations.
Migrations
__________________ _______________________
_____________________________
_____________________________
_____________________________
_____________________________
Appendix 1.5
4.2 Working with the textbook pp. 65-66;
What causes population displacement?
Types of migrations | Causes | Where? Where? |
|
Conclusion: ______________________________________________________________________________
_____________________________________________________________________________________
Appendix 1.6
II) Consolidation of the material covered.
Studies of the reasons for the movement of residents from the regions of Russia to the NPR, conducted in 1998, showed that 100% of the respondents were moved to move precisely by primary needs. At the same time, in the first place - 89% put the need for a stable income,
11% - the possibility of safe procreation, 2% - the possibility of obtaining housing.
Let's imagine what consequences will entail: the lack of vacancies, the policy of the leaders of the Norilsk plant to curtail production.
Final consolidation in the form of mutual verification; grading in the journal.
III) Homework (at the choice of students):
1) Exercise number 9, p. 77;
2) Exercise No. 9 (additional), page 78;
3) Exercise number 10, p. 78;
Preview:
Related lesson: Placement and migration of the world's population.
Appendix 1.1
Population placement
average density highest density lowest density
population population population
45 people/km more than 600 people/km less than 1 person/km
1 Southeast Asia on every continent
2 South Asia
3 Europe
4 East S.A
Appendix 1.2
Distribution of the world's population. Causes of uneven distribution of the population.
State | China | Canada | Australia | Russia |
Mainland | Eurasia | North America | Australia | Eurasia |
Max Density | 100-200 | 1-10 | 200-600 |
|
Where? | T.O coast | A.O coast | Southeast | Center, south |
Why? | natural conditions | historical settlement | natural conditions | economic centers |
Min density | less than 1 | less than 1 | less than 1 | less than 1 |
Where? | west | north | center | north |
Why? | Himalaya mountains | harsh conditions | desert | harsh conditions |
Conclusion: The distribution of the population is extremely uneven. Several reasons can be distinguished: the natural factor, historical conditions of settlement, socio-economic conditions.
Appendix 1.3
Use the Geographic Encyclopedic Dictionary. place names. Ch. editor A.F. Treshkov. - M: Soviet Encyclopedia, 1993
Appendix 1.4
SETTLEMENT AND PLACEMENT OF THE POPULATION
The process of distribution and redistribution of the population over the territory is called resettlement. The spatial pattern of settlement is called accommodation population.
The main patterns of population distribution.
| About 70% of the population is concentrated on 7% of the territory, and 15% of the land is completely uninhabited. | ||||
| 90% of the population lives in the northern hemisphere | over 50% of the population - up to 200 m above sea level, and up to 45 - up to 500 m | about 30% - at a distance of no more than 50 km from the sea, and 53% - in a 200-km coastal strip. | ||
| 80% of the population is concentrated in the Eastern Hemisphere | the majority of the population lives above 1000 m in Bolivia, Mexico, Peru, Ethiopia, Afghanistan. | |||
| average density: 45 people / km 2 | only in Bolivia, Peru and China (Tibet) does the boundary of human habitation exceed 5000 m | |||
| on 1/2 land, the population density is less than 5 people / km 2 | ||||
| maximum population density: Bangladesh - 700 people / km 2 | ||||
In small, mostly island states the density is even higher than in Bangladesh: in Singapore - more than 5600, in the Maldives - 900, in Malta - 1200, in Monaco - 16400 people. For 1 sq. Km.
REGIONS OF THE LARGEST POPULATION CLUSTERINGS:
- East Asia (China, Japan, Korea)
- South Asia (India, Bangladesh, Sri Lanka, Pakistan)
- Southeast Asia (Indonesia, Philippines, Thailand, Malaysia, etc.)
- Europe
- Atlantic coast. America (Northeast USA).
REASONS FOR IRREGULARITY
- Climate
- Relief
- Historical features of the settlement of the territory
- Socio-economic factors (recently)
TYPES OF ACCOMMODATION URBAN RURAL group (village) scattered (farm) Russia, China, Japan, a number of foreign European countries, in most developing countries USA, Canada, Australia, in a number of foreign European countries
MIGRATION (MECHANICAL MOVEMENT) OF THE POPULATIONA great impact on the size, composition and distribution of the population in individual countries and around the world is exerted by its movements, called population migrations. main reason migrations are economic, but they are also caused by political, national, religious, ecological and other reasons.
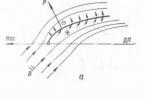
Figure 7. Types of migrations.

International (external) migrations of the population arose in ancient times, continued in the Middle Ages, primarily in connection with the Great geographical discoveries, but received the greatest development in the era of capitalism.
The biggest "migration explosion" began in the 19th century. For a long time, Europe remained the main center of emigration, where the development of capitalism was accompanied by the “pushing out” of part of the population to those areas where free lands, the economy developed rapidly and created a demand for labor. In total, from the beginning of emigration until the Second World War, 60 million people left Europe. The second center of emigration has developed in Asia. Here, Chinese and Indian workers (coolies) became emigrants, who were recruited to work on plantations and mines. The main centers of immigration were the USA, Canada, Brazil, Argentina, Australia, New Zealand, South Africa.
After the Second World War, the size of international migrations began to increase again and by the end of the 20th century. reached the scale of a new "migration explosion". As before, the main reason for these migrations is economic, when people leave in search of a new place of employment, a better life. Such migrations are called labor migration. As a result, at the end of the XX century. 35-40 million people are already working permanently or temporarily outside their countries, and taking into account family members, seasonal workers and illegal emigrants - 4-5 times more. Most foreign workers are in Switzerland, where they account for about 10% of employees. The main flow of such labor emigrants is directed from developing to economically developed countries. But labor migration also exists between economically developed and between developing countries.
The main reason for this kind of international labor migration is the large gap in living standards and wages between economically developed and developing countries. However, in the USA and Western Europe, immigrants, especially young people, are often forced to take on the most difficult, low-paid, and unprestigious jobs. Of course, they can also be found in modern enterprises. But the majority settle either in mines and construction sites or in the service sector, becoming sellers, peddlers, waiters, elevator operators, watchmen, chauffeurs, garbage collectors, etc.
Today there are three main centers of attraction of labor resources in the world.
Firstly, it is Western Europe (especially Germany, France, Great Britain, Switzerland), where a significant layer of immigrant workers from a number of countries of Southern Europe (Italy, Spain), Western Asia (Turkey) and North Africa; in the 90s the influx of migrants from of Eastern Europe and CIS countries.
Secondly, this is the USA, where only legal immigration (mainly from countries Latin America, Asia and Europe) is about 1 million people a year, and illegal - and even more.
Thirdly, these are the oil-producing countries of the Persian Gulf, in the total population of which labor migrants (from Egypt, India, Pakistan and other countries) far exceed the local population. Canada and Australia also remain countries with significant immigration, but to an even greater extent Israel, whose population is increasing by 2/3 due to the immigration influx to a large extent from Russia and some other CIS countries.
In the second half of the XX century. a new form of external migration appeared, which, in contrast to the previous "muscle drain", was called "brain drain"(or "brain pumping"). Its essence lies in poaching foreign scientists, engineers, doctors and other highly qualified specialists. It began with an outflow from countries Western Europe in the USA, but then the developing countries also became the main suppliers of such "intellectual" immigrants. The "brain drain" has an extremely negative effect on the economy and culture of these countries, where the intelligentsia stratum is still small. In the late 80s - early 90s. in connection with the political and economic crisis, the "brain drain" from Russia, Ukraine, and other countries that were previously part of the USSR increased.
Along with labor migrations, mass migrations for political, ethnic, religious, environmental and other reasons also persist. First of all, such a recent phenomenon as the formation of refugee flows is connected with them, the total number of which in the world has already exceeded 20 million people. It is clear that people are fleeing primarily from areas of acute political and military conflicts. In the first half of the 90s. The first place in the world in terms of the number of refugees (more than 6 million) was occupied by Afghanistan, where before that there had been a long and bloody war. More than 2 million refugees left Rwanda, more than 1.5 million - Iran and Mozambique, 1.2 million - Bosnia and Herzegovina. Mass flows of refugees are also characteristic of a number of CIS countries.
There are several types of internal (intrastate) migrations of the population. These include the movement of people from rural areas to cities, which in many countries is the main source of their growth. Nowadays, this type of internal migration has taken on such proportions that it has come to be called the "great migration of the peoples of the 20th century." Territorial redistribution of the population also occurs between large and small cities. Migration is associated with colonization and the development of new lands. This type of migration is typical primarily for large countries with sharp contrasts in population density - Russia, Kazakhstan, Canada, Brazil, Australia and China.
Recently, the outflow of people from various "hot spots" has become more and more massive, including not only military-political conflicts, but also areas of ecological disaster. In essence, these are the same refugees (for example, environmental refugees), but they are usually called displaced persons.
URBANIZATION
City- large locality, performing industrial, organizational, economic, managerial, cultural, transport and other (but not agricultural) functions.
A city is a concentration of population and economy in a relatively small area.
The "largeness" of a city is determined by the number of people living in it, the so-called. population. At the same time, a city is considered in Scandinavian countries with a population of more than 200 people, in Canada, Australia - over 1 thousand, in Germany, France - over 2 thousand, in the USA - over 2.5 thousand, India - over 5 thousand, the Netherlands - over 10 thousand, in Russia - over 12 thousand, and in Japan - over 30 thousand.
Table 16. Dynamics urban population peace
Urbanization- the process of urban growth, increasing the proportion of the urban population in the country, region, world, increasing the role of cities in all spheres of society, the predominance of the urban lifestyle over the rural.
Urbanization rate - level of urbanization- share of the urban population in the total population.
Table 17. Dynamics of the share of the urban population by major regions world (%).
Regions 1950 1970 1990 1995 Africa 15 23 30 34 North America 64 70 75 75 Latin America 41 57 65 74 Asia 17 25 34 34 Europe 54 64 73 74 Australia and Oceania 61 65 68 70 China 30 Russia 76
Table 18. Classification of countries by level of urbanization, (%).highly urbanized medium urbanized slightly urbanized over 50% 20-50% up to 20% - Belgium (95), Germany, Denmark, Great Britain, Iceland, Spain, the Netherlands, etc.;
- Israel (90), Kuwait (94) and others;
- USA (74), Guadeloupe (90), Guyana (81), Argentina (86), Uruguay (89), Chile (84);
- Australia (85)
- Portugal (30), Albania (36);
- China (40), India (27), Indonesia (31);
- Tajikistan, Turkmenistan, Uzbekistan, Moldova
Cambodia (11), Laos (16), Bhutan (13), Nepal (7), Oman (9), Burkina Faso (9), Burundi (5), Rwanda (7), Ethiopia (12) Industrialized: 75%
EU countries: 80.8%Worldwide: 47%
Developing: 41%Least developed: 14.7% Three common features of urbanization common to most countries
- Rapid urban population growth, especially in less developed countries. Today, developing countries account for more than 4/5 of the total annual increase in the number of urban residents, and the absolute number of city dwellers has already far exceeded their number in economically developed countries. According to the absolute indicator of urban residents, China is the leader, although in terms of the level of urbanization, this country belongs to the medium urbanized ones.
- Continued concentration of the urban population, primarily in large cities.
Table 19. Growth in the number of "millionaire" cities in the 20th century.
Table 20 . Largest countries in the world by urban population (in 2000)
Countries
Urban population, million people
Share of urban population,
%
China
India
USA
Brazil
Russia
Japan
Indonesia
Mexico
Germany
Great Britain
Nigeria
48,1
Türkiye
48,1
France
43,9
Philippines
41,1
Italy
38,6
- The "spread" of cities, the expansion of their territory, the transition from a "point" city to urban agglomerations- compact spatial groupings of urban settlements united by diverse and intensive industrial, labor and cultural ties.
To this we can add the deterioration of the environmental situation in cities and industrial centers.
Lately for characterization largest cities of the world, as a rule, data on the agglomerations formed by them are used, since this approach is more correct.
Table 21. Largest agglomerations of the world in 2000Agglomerations
The number of inhabitants
million people
Agglomerations
Numberresidents,
million people
Tokyo
26,4
Dhaka
11,7
mexico city
17,9
Karachi
11,4
Mumbai (Bombay)
17,5
Paris
11,3
Sao Paulo
17,5
Delhi
11,3
NY
16,6
London
11,2
Moscow
13,4
Osaka
11,0
Los Angeles
13,0
Beijing
10,8
Shanghai
12,9
Jakarta
10,6
Lagos
12,8
Lessons: 5 Assignments: 9 Quizzes: 1
Leading ideas: The population is the basis material life society, an active element of our planet. People of all races, nations and nationalities are equally capable of participating in material production and in spiritual life.
Basic concepts: demography, population growth and growth rates, population reproduction, birth rate (birth rate), mortality (death rate), natural increase (natural increase rate), traditional, transitional, modern type reproduction, population explosion, demographic crisis, demographic policy, migration (emigration, immigration), demographic situation, sex and age structure of the population, sex and age pyramid, EAN, labor resources, employment structure; resettlement and accommodation of the population; urbanization, agglomeration, megalopolis, race, ethnos, discrimination, apartheid, world and national religions.
Skills and abilities: be able to calculate and apply indicators of reproduction, labor supply (EAN), urbanization, etc. for individual countries and groups of countries, as well as analyze and draw conclusions (compare, generalize, identify trends and the consequences of these trends), read, compare and analyze gender and age pyramids various countries and groups of countries; using maps of the atlas and other sources to characterize changes in the main indicators on the territory of the world, to characterize the population of the country (region) according to the plan using the maps of the atlas.
Canada - Indians.
French colonization interrupted the course of the natural development of Indian tribes, many of them were exterminated, and some were forced to migrate from their former places of residence.
Since 1600, French colonists were allowed to move to Canada, who settled along the St. Lawrence River. In the 17th century the French migrate throughout North America, conquering Martinique, Guadeloupe, Guiana, Madagascar and a number of territories in India.
In the XVIII century. France ceded a number of colonies in the Caribbean and Canada. However, a significant French ethnic component is still preserved here.
Review questions
1. What historical periods stand out in the dynamics of migration processes? List their main features.
2. Describe migration in primitive society. What are the features of migratory movements during the periods of the ancient, middle and new stone age?
3. Migrations in the era ancient world and their historical significance (migration to Mesopotamia and the Nile Valley. Aegean resettlement, resettlement of the final
Chinese in the Mediterranean, migration of Jewish tribes, great Greek colonization, migration to Ancient Rome, migration of Germanic tribes).
4. Causes of general migration in the era of the Great Migration of Nations and its socio-economic significance for social development.
5. The main consequences of migration in the Middle Ages (migrations of Arabs, Reconquista, migrations of "barbarian" peoples, Celts, migrations in the Viking Age, migrations of nomadic tribes).
6. Commercial migration during the period of urban growth: what is its essence and socio-economic importance?
7. What are the features of migration during the period crusades and the migration of religious preachers?
8. Show the ethnic character of migration during the Age of Discovery.
Chapter I.2. MODELS OF MIGRATION PROCESSES IN THE EARLY PERIOD OF GLOBALIZATION
Wars and the formation of new states and empires have always been associated with the migration of the population (voluntary or forced).
Population migration is an integral part of globalization. For the early period of globalization, the following main models of migration processes can be distinguished.
First - forced-compulsory model - characteristic of the period of mass colonization. It corresponded to the needs of the imperial centers of Western Europe in the creation and development of the colonial system. It was at that time that the flourishing of "distant" trade and the opening of global communication lines (diagram
Scheme 1.2.1. Formation of the capitalist market and migration of the late XV-early XVI centuries.
The creation of new capitalist markets and the development of civilization in the New World prompted a large number of Europeans to leave Europe and move
Xia to America and Africa to manage new colonies. The main routes for trade and colonization ran between Western Europe, west coast Africa and America. The movement of goods and weapons from Europe to Africa, African slaves to America, raw cotton and sugar from America back to Europe formed a kind of transatlantic triangle.
The most important component of the commodity exchange of that time was the transportation of slaves. Between 1500 and
1850s approximately 10 million slaves were transported from Africa to America. The slave trade was a form of deportation (Table 1.2.1).
Table 1.2.1. Deportations of slaves from Africa by some European countries over the centuries, thousand people
19th century | |||||
Portugal | |||||
Netherlands | |||||
The main motive of the slave trade was to obtain economic benefits from the exploitation of cheap labor on the plantations of the colonial estates and in the household. The first to engage in the slave trade were the Portuguese, who began this species"business" in 1441, from 1501 the Spaniards joined the process of the slave trade, and in 1562 - the British. Gradually, the "human resources" in western Africa were depleted: the "worked out zone" of the active slave trade, having formed in the area of \u200b\u200bpresent-day Senegal, quickly moved towards the Ivory Coast, then Nigeria, and by the end of the 18th century. towards the Congo and further south, up to Angola.
The Arab slave trade did not stop even after Europe, which colonized Africa, officially
formally renounced and dissociated itself from slavery: in Oman and Zanzibar, slave markets functioned as far back as late XIX V.
The first 20 African slaves were brought to the territory of modern USA in 1619 in the state of Virginia. In total from the 16th to the middle of the 19th century. Approximately 11 million black slaves were deported to America. If we take into account those who died during capture or transportation, then the number of people “affected” by deportation should be increased to 15 million people.
In the XVIII century. the importation of slaves and their sale in the slave markets of America were heavily criticized. In many countries, slavery was condemned from the point of view of human and Christian morality. At the end of the XVIII century. The anti-slavery protest movement expanded significantly.
The first ban on the slave trade was passed in 1792 by Denmark, followed in 1807 by Great Britain. In 1825, the Congress of Vienna banned the transatlantic slave trade (although in some countries slavery continued to exist and was an important factor in the economic structure, for example, in Brazil and some US states).
So, we list the main milestones of the slave trade:
■ 1441 - The Portuguese began the slave trade;
■ 1501 - inclusion in the process of the slave trade of Spain;
■ 1562 - inclusion in the process of the slave trade of England;
■ 1619 - the first 20 African slaves were imported into the United States;
■ 1688 - the emergence of the abolitionist movement in the USA;
■ 1740 - over 100 thousand African slaves in the English colonies;
■ 1792 Danish slave trade banned;
■ 1794 - passage of the "Fugitive Slave Law" by the US Congress;
■ 1807 Prohibition of the slave trade in Great Britain;
■ 1816 - Creation of the American Colonization Society;
■ 1820 Missouri Compromise passed;
■ 1822 African slave return migration begins;
■ 1825 - The Congress of Vienna introduced a ban on transatlantic trade.
The second component of the migration flow during the period of colonization was the active migration of Europeans to North America, South Africa, Australia, New Zealand. Significant migratory flows were associated with the movement of Europeans to permanent place of residence in distant countries discovered by explorers and enslaved. Only in 1846-1924. About 50 million Europeans moved to overseas colonies.
Parallel to this process there was a forced resettlement of criminals from Europe to Australia and America. A large number of people were displaced not only from their native places, but also “sentenced” to work in a new place (Map I.2.1). A transatlantic triangle arose: Europe-Africa-America - Europe; continued forced relocation of criminals from Europe to Australia and America (1788), as well as the migration of free white settlers from Europe to North and South America, Australia (1793), New Zealand, South Africa.
We can say that if earlier free white colonization was a small share in the migration

nye flows, then during this period it became the main one. This "great migration" of Europeans was the same age as the industrial revolution and rapid urbanization in Europe.
The consequences of international colonial migrations are shown in Figure I.2.2.
Migrations are thus inextricably linked to social and economic transformations during the period of colonization.
In line with global trends, the development (colonization) of a huge part of the Eurasian continent took place, where in the 19th century. completed the creation of the Russian Empire
Map I.2.1. Colonial migrations (XVII-XIX centuries)
- - - > - European colonizers
-----> - slave trade -- ···- hired workers
Scheme I.2.2. Consequences of international colonial migrations
The process of internal migration of the population of Russia, associated with the settlement of the country, at each historical stage had specific features, but in general was characterized by a relative stability of directions.
So, in the IX-XII centuries. Slavic population Ancient Rus' gradually populated the territory in the basins of the Oka, the Upper Volga, and the North. In the XIII - XIV centuries. increased movement to the north and north-east of Eastern Europe. Started in the 16th century a steady and centrifugal migration process led to the movement of the population to the south from the original center of the Russian state.
From here, the population went to Novorossia, to the Caucasus, beyond the Volga and further beyond the Caspian Sea, especially beyond the Urals, to Siberia, to the shores Pacific Ocean. As noted by V.O. Klyuchevsky, the history of the Russian state is the history of a continuously colonized country!
According to A. Akhiezer, the process of colonization, which played such an important role in the history of the Russian
1 Klyuchevsky V.O. Works. M., 1956. T. 1. S. 309-310.

state, in its essence was at the same time colonization-migration2 (Map I.2.2).
But the colonization-migration of Russian territories has a number of specific features compared to other countries:
■ mass colonization of the eastern and southern regions was carried out later than in Western countries(except for Siberia);
■ unlike the colonies of other countries (for example, Spain, Great Britain), the developed and settled territories were adjacent lands located in close proximity to the metropolis and long before the start of active colonization had with it trade and economic relations; and the history of Russian colonization of adjacent regions did not know the death of not only millions (as in North America), but even thousands of their indigenous inhabitants or the forced resettlement of aborigines in the reservation (as, for example, was the case during the colonization of North and Central America, Australia).
The second model of migration movements, characteristic of the period early XIX V. and until the middle of the 20th century, can be called industrial-classical.
Migration movements of this period were due to two interrelated processes: on the one hand, the ongoing colonization, and on the other hand, industrialization in the countries of Western Europe. Migration movements of that time are characterized by resettlement without any restrictions, the main thing in them is economic motives. Another feature of this period is the expansion of the areas of departure of migrants and the strengthening of the cultural difference between them and the indigenous inhabitants of the places of settlement.
During this period, there is an active migration of Europeans to South Africa, Australia, New
2 Akhiezer A.S. Emigration from Russia: cultural and historical aspect // Free Thought. 1993. No. 7. S. 70-78.
Map I.2.2. The main world migrations of the population in the 17th-1st half of the 19th centuries.
Migration from Europe: I - to North America
II - to South and Central America
III - to South Africa (Boers) and the beginning of the colonization of Australia IV - the export of African slaves to America
V - resettlement of Russian and partly Ukrainian peoples VI - Chinese migrations to Southeast Asia
VII - the beginning of the recruitment of Indian coolies to East and South Africa VIII - internal migrations to the USA
Zealand, Canada, South America and especially North America (table I.2.2).
Table I.2.2. Emigrants from European countries to the countries of resettlement capitalism and the USA, million people
Emigration | |||
Total from Europe | |||
From the countries of the "old emigration" (1840-900): | |||
UK, Ireland, Germany, Northern Europe | |||
From the countries of the "new emigration" (since 1880): Italy, Russia | |||
sia, Spain, Portugal, Austria-Hungary, Balkan- |
Migration processes in the world are becoming more intense. Migration statistics reflect an upward trend even during periods of economic crisis. However, this process is beneficial to both parties - the country sending migrants and receiving them.
Reasons for the resettlement of citizens
As the statistics of migration in the world show, the influx of people from other countries outstrips the growth rate of numbers:
- 2013 - their number was about 232 million people;
- 2015 - the figure reached 244 million. Of these, 20 million people are refugees.
Most often, the mass movement of people is based on economic reasons. World population migration statistics highlight the following factors:
- relocation of low-skilled workers to countries with high level economy;
- migration between countries with the same level of development due to social or cultural factors;
- statistics on migration in the world reflects the movement of labor resources from states former USSR and Eastern Europe to its Western part and the USA;
- there is also a movement of skilled workers from prosperous countries to developing ones due to high wages and careers.
Among other factors influencing mass movements, population migration statistics also highlight:
- military conflicts;
- clashes on religious or ethnic grounds;
- unstable political situation;
Features of modernity
The statistics of labor migration in the world demonstrates a change in the structure itself - if earlier people left their homeland in search of a better life simple people who do not have qualifications, today highly qualified specialists and scientists are leaving for other countries. The global process of resettlement, as noted by the statistics of migration in Russia, has also covered our country.
Where do people come to Russia from?
The inflow occurs mainly at the expense of the CIS countries:
- 2014 - 92%;
- 2015 - 89%.
The main part is migration from Ukraine. The statistics for 2016 is 35% (178 thousand people out of 512 thousand who arrived from the CIS countries). However, for the first three months of 2017, labor migration statistics show a decrease in the number of arrivals by 8.1% compared to the first quarter of 2016. To a large extent, the decline was due to the Ukrainians.
Consequences of illegal entry
Illegal migration in the Russian Federation, according to statistics, is about 3.6 million of the total number of citizens who entered the country. Most illegal immigrants have expired permits. Illegal migration statistics indicate the consequences of illegal entry and stay in the country:
- an excess of cheap labor;
- shortfall in the budget of tax collections;
- expansion of the shadow economy;
- overpopulation;
- . Statistics on migration of the Ministry of Internal Affairs notes among law enforcement officers and employees of relevant services;
- exacerbation of social tension in society;
If we analyze the statistical indicators of population migration, then despite the measures taken by the legislative and executive authorities, the situation is fraught with negative consequences.
Observed trends
According to migration statistics by country for 2016, the largest percentage of foreigners who arrived in the Russian Federation were citizens of the CIS. At the same time, the statistics of migration of the population of the CIS countries indicate an increase in the share of the labor force from Kyrgyzstan, with a gradual decrease in the number of Ukrainians.
External migration in Russia also continues. Statistics show the outflow of skilled workers:
- over 120 thousand people left the country in 8 months of 2015;
- for 8 months of 2016, more than 200 thousand people left. Of these, Rosstat recorded 34 thousand citizens who received new citizenship.
Migration statistics by age show that most of those who left are students and young entrepreneurs who are not satisfied with the lack of guarantees in the conduct. Statistics on the migration of highly qualified personnel names the following reasons for the outflow of people:
- the possibility of acquiring their own housing;
- ensuring personal security;
- availability of professional medical services;
- desire to receive .
The outflow of qualified personnel
Labor migration statistics of Russians states that the number of citizens with higher education accounted for 46% of the total number of those who left in search of work in 2014. They were not in demand at home.
Migration statistics in Canada indicate that 300–700 Russian citizens. Thanks to the government's policy towards foreigners, it is easier to get a job and adapt to new conditions here.
International labor migration statistics operate on official data, which do not include the number of people working illegally. The actual scale of outflow of labor resources is much higher. The number of Russian citizens living abroad at the end of 2015 - the first half of 2016:
| № | host country | Number, thousand |
| 1 | USA | 415 |
| 2 | Canada | 214 |
| 3 | Israel | 268 |
| 4 | Estonia | 89 |
| 5 | Germany | 201 |
| 6 | Spain | 66 |
| 7 | Czech | 33 |
| 8 | Latvia | 42 |
| 9 | Austria | 30 |
| 10 | Finland | 30 |
| 11 | Bulgaria |
Internal displacement of the population
With the departure of a large number of specialists, the statistics of internal Russian migration is growing. In many cities, there is a shortage of workers, which attracts workers looking for better jobs with higher pay and people left without work after the bankruptcy of enterprises. As the statistics of migration of the population of Russia shows, its main reasons lie in the economic plane:
- labor market needs;
- the supply and quality of the labor force;
- wage level.
Urbanization factor
The statistics of internal migration in Russia show that about 1.7 million people, or 1.2% of the population, move around the country every year. Relocation is carried out mainly to regional cities, which have more opportunities for employment.
At the same time, the statistics of internal migration in Russia by regions show a reduction in the able-bodied population.
Migration statistics in Bashkortostan show that in 2016, 151.3 thousand people arrived in the republic, and 159.7 left. The outflow of the population for the year amounted to 8.5 thousand people.
The outflow of the population in the Siberian Federal District, according to the statistics of internal migration, amounted to more than 244 thousand in 2000–2008. In the Far East, over 10 years - 187 thousand. transport infrastructure would help to improve the situation to some extent.
The statistics of migration within Russia depends not only on economic, but also on climatic features. More favorable weather conditions in central and southern regions attracted by the opportunity to practice.
CIS countries
An alarming situation is also developing in the CIS countries. More than 16 thousand people received migration statistics in Kazakhstan in 2015, but more than 30 thousand left the country. In the first quarter of 2016, the number of people who left the country increased by 20.3%, and the negative balance amounted to 2381 people. An analysis of labor migration statistics in Kazakhstan shows that the main flow of people leaving is directed to the CIS countries.
Positive dynamics is shown by the statistics of natural movement and migration of the population in Belarus. According to official data:
- in 2016, 7.3 thousand people left the country to work. Almost three times as many came to the country;
- in January-March 2017, 1.8 thousand people left. Arrived - 4.3 thousand.
The refugee problem
Migration statistics in Europe in 2015 recorded an influx of 1 million refugees, most of whom were Syrians. In 2016, their number was reduced to 355 thousand, but the problem has not yet been resolved. The statistics of international migration notes: if earlier the main share of foreigners came in search of work, now refugees forced to leave their homeland have come to the fore.
World migration statistics on the number of foreigners living in the country identifies five leaders:
- Luxembourg - 45.9%.
- Switzerland - 29.6%.
- Sweden - 18.5%.
- Austria - 17.4%.
- Germany - 14%.
UN statistics on migration highlight the main factors that attract refugees to European countries:
- lack of border control within the EU, which allows you to move freely within the territory;
- a high level of social benefits and the opportunity to get a job.
Germany's population growth due to refugees
German migration statistics claim that about 1/3 of the main flow of refugees falls on this country. If the current situation continues, then the migration increase in 2017 will amount to 250 thousand people. This will increase the total population growth to 50 thousand people.
Composition of migrants in France
France's migration statistics predict an increase of 67,000 people in 2017. Mostly they come from North Africa. About 1/3 of them live on social benefits and are below the poverty line.
UK and Switzerland
In 2015, migration in the UK approached a record number. Statistics recorded an increase of 20 thousand people per year - from 313 to 333 thousand. However, the authorities note that the increase was not due to an increase in the number of arrivals, but due to a decrease in their outflow.
Swiss migration statistics show a 12% reduction in labor inflows in the first half of 2017. The figure has reached 25 thousand people. This is the lowest figure in the last 12 years.
Spanish position
Migration in Spain receives tough opposition from the state. According to statistics, only 1.1 thousand people were accepted by the country out of 17 thousand, in accordance with obligations to the EU. The Spanish government explains the low rate of acceptance of refugees by the need for their thorough verification.
Migration flows in the USA
The main increase in the country's population is provided by labor migration to the United States. Statistics show that in 2000-2010 more than 14 million people arrived in the country. Most of them are from Mexico or South-East Asia. Illegal migration to the USA is a big problem. Statistics report that out of 40 million foreigners in the country in 2015, 12 million arrived illegally. The number of people arriving from the Middle East and Latin America is growing rapidly.
China's migration statistics show that the flow of labor from this country remains one of the largest in the world. It ranks fourth in terms of population outflow. More than 8 million people live outside the country.
Changing Japan's Migration Policy
Japan's migration statistics indicate that despite the influx of labor, its level in the country remains low. In connection with the negative demographic processes taking place in the country, in 2016 the government revised the migration policy.
Labor migration statistics at the beginning of 2017 recorded more than 1 million workers, most of them technical trainees.